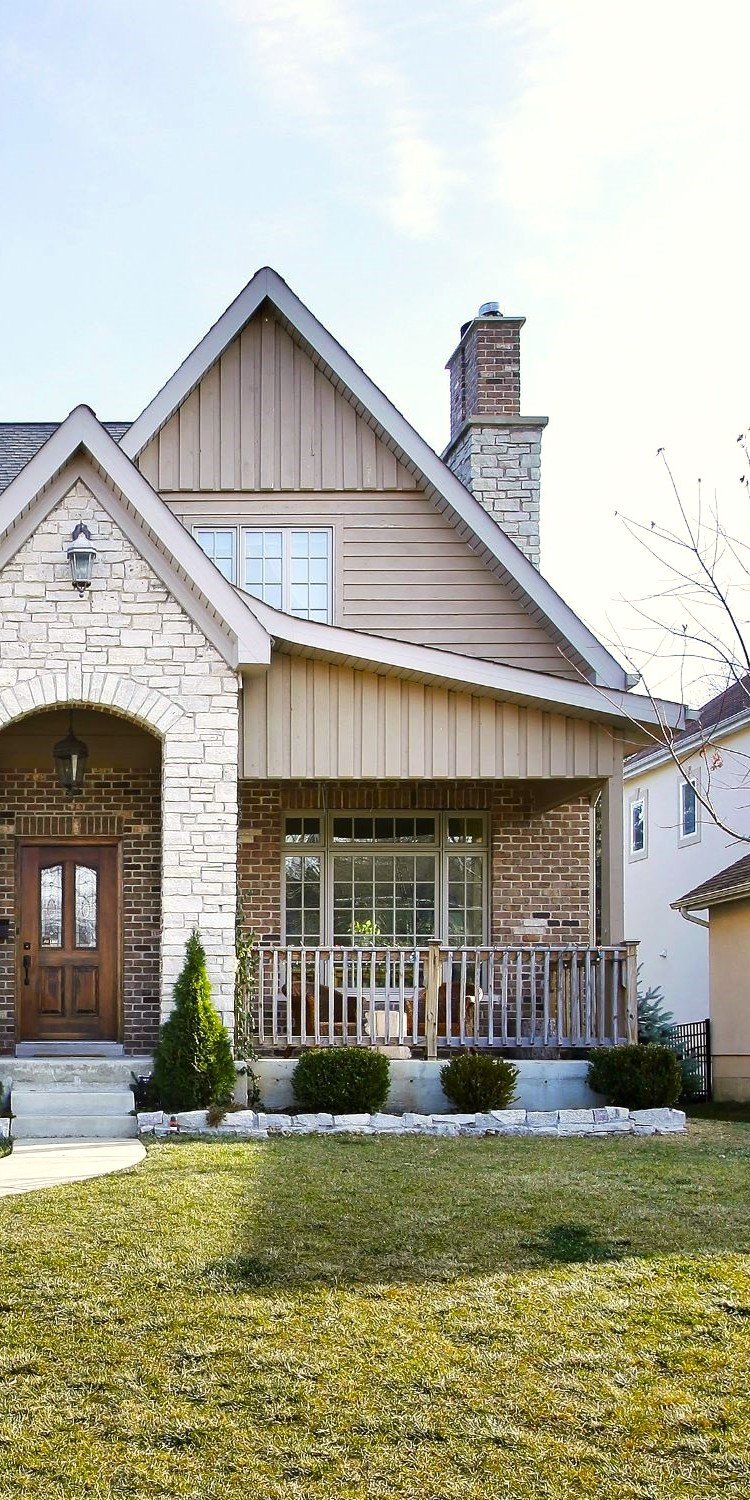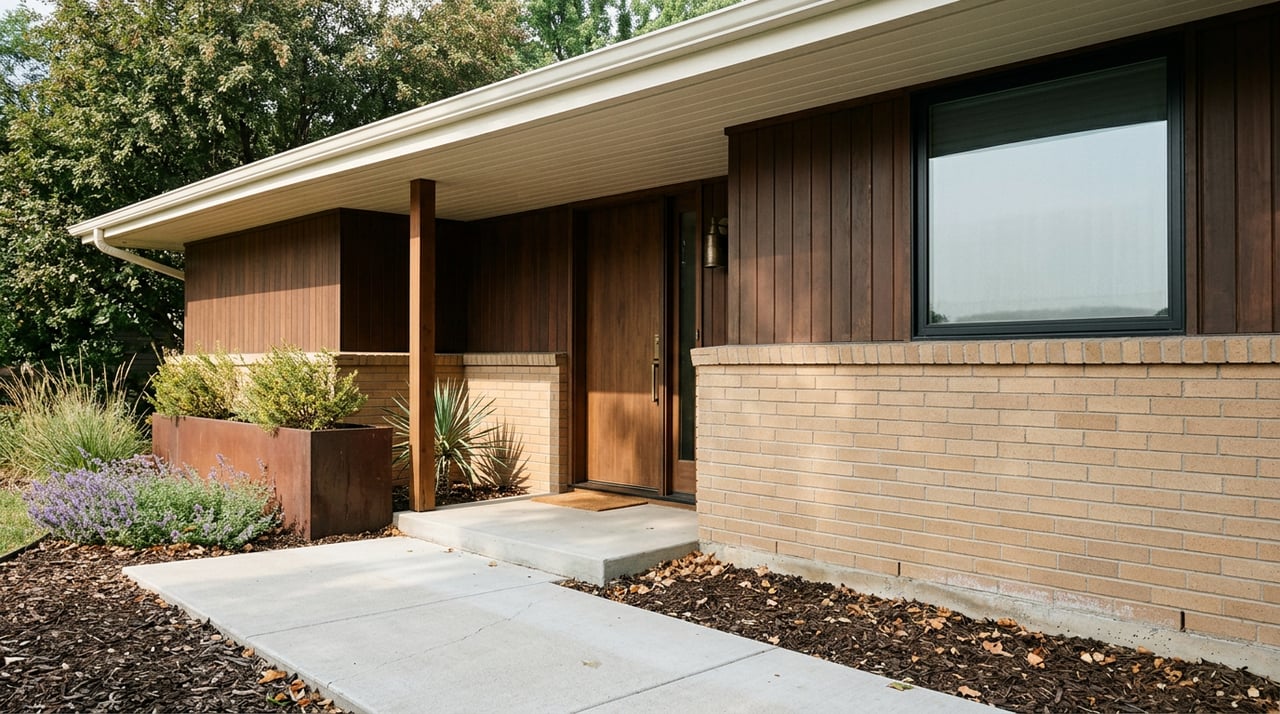
The portals give you one number for Boulder. In May 2026 that number was somewhere between $854,000 and $971,000 depending on which aggregator you asked. A buyer relocating from Washington, Chicago, or San Francisco, the three metros that lead inbound search interest into Boulder right now, reads that figure and starts underwriting a shortlist. Then they land, drive from Gunbarrel to Mapleton Hill in twelve minutes, and discover the medians on those two blocks are three times apart.
The thesis of this piece is straightforward. Boulder does not have one housing market. It has roughly four, stitched together by a greenbelt that caps supply and a set of micro-features that assign most of the price. Reading the citywide median as if it describes any specific street is the single most expensive mistake a relocation buyer can make here, and the fix is a block-level read before the first showing.
The number on the portals, and why it blends away the decision
Depending on where you looked in May 2026, the "Boulder median" was:
- Roughly $915,000, with 2.68 months of supply, 50.5 days on market, and a 97.92% sale-to-list ratio, per Houzeo's May 2026 snapshot.
- The Zillow Home Value Index sat near $971,000 as of May 31, 2026, down about 1.5% year over year.
- Redfin's trailing three-month median through May 2026 was closer to $854,000 at around 50 days on market.
These are all defensible numbers pulled from different methodologies over slightly different windows. They agree on the story that matters. The market is balanced, not frenzied. Homes are moving in roughly seven weeks. Sellers are conceding a couple of points off list. Boulder County as a whole ran a lower median of about $736,000 through April 2026, which tells you how much the outlying towns pull the county figure down.
None of that tells you what your money buys on a specific street. That is the number you actually need.
What each budget buys, block by block
The table below reads left to right as a budget escalates. Every neighborhood named has a published median in a public aggregator; the interpretation is the local part.
| Budget band | Representative Boulder pockets | What the money is buying |
|---|---|---|
| Under $800K | Gunbarrel (median around $795,000), condo and townhome stock across the city (entry near $600,000) | Larger lots and single-family space if you accept a drive into central Boulder, or attached product close in. |
| $800K to $1.1M | Martin Acres, parts of South Boulder around Table Mesa (area median around $882,000) | Mid-century single-family homes on established streets, mostly original or lightly updated, with quick access to South Boulder Creek Trail and NCAR-side open space. |
| $1.1M to $1.5M | Table Mesa South (median around $1.15M to $1.25M), Old North Boulder ($1M and up) | Renovated mid-century stock, better trail adjacency, and the first budget where "walk to a real amenity" becomes plausible. |
| $1.5M to $2M+ | North Boulder proper (median around $1.32M and climbing at the top end), Chautauqua and West Boulder ($1.5M to $2.5M+) | Newer builds or fully renovated homes, views, and the NoBo Art District walk-shed anchored by Wonderland Lake and the Foothills Nature Trail. |
| $2M and up | Newlands, Mapleton Hill (median around $2.44M), Juniper/Kalmia (ZHVI near $2.89M) | Historic architecture, downtown walkability, and trail heads like Mount Sanitas essentially at the front door. |
Two things to sit with in that table. First, the citywide median lives inside the second row. If you underwrote your search to it, you were shopping Martin Acres and lightly-updated Table Mesa, whether you meant to or not. Second, the jump from row two to row five is not a jump in square footage. It is a jump in vintage, walkability, and adjacency. Buyers routinely tell us they were surprised that a smaller home on Mapleton Hill trades above a larger, newer home in Gunbarrel. That surprise is the whole market in one sentence.
The mechanism: a fixed greenbelt makes micro-features do the pricing
Boulder's supply is not a slow-turning dial. It is close to a hard cap. Decades of open-space protection and land-use rules have limited outward growth, which is why inventory in May 2026 was up only about 11.6% year over year and months of supply moved from 3.09 to 2.68. Compared to Denver's roughly 3.2 months of inventory in Q1 2026, Boulder still runs tighter even in what is otherwise a balanced national picture.
When supply is fixed, price differentiation moves to whatever is not fixed. In Boulder that means four things do most of the work: walkability to Pearl Street or a neighborhood commercial node, direct trailhead access, view corridor, and the depth and orientation of the lot. A south-facing yard within a five-minute walk of Mount Sanitas is a different asset than a north-facing yard on the same block, and the price per square foot will say so.
Buyers who lose the home they want in Boulder almost never lose on price. They lose because they underwrote to a citywide median and were still calibrating when a properly priced home in the pocket they actually wanted cleared in three weeks at 98% of list.
That is the friction. The market is patient enough at the wrong pocket to feel slow, and quick enough at the right pocket to feel like 2021, all inside the same ZIP code.
Where relocation buyers most often misprice the search
A few patterns show up again and again in transactions here, and they are worth naming before you write your first offer.
Condo data and single-family data need to be separated. The city's roughly $600,000 entry point is almost entirely attached product. Pulling that into a single-family search inflates what you think your dollar buys. Ask for the median specifically on the property type you intend to own.
Older housing stock is the trade, not the flaw. In Newlands, Mapleton Hill, and much of Table Mesa, buyers accept 1940s to 1960s construction to secure the address. Inspection findings on knob-and-tube, cast iron waste lines, and original sewer laterals are normal here, not deal-breakers. Underwriting a renovation reserve of 5% to 10% of purchase price is more useful than assuming a rebate at closing.
Price drops are not the same as negotiability. Across Boulder County, roughly 30% of listings had a price cut in the last thirty days, and the sale-to-list ratio still landed near 97%. That means most of the "concession" happens before the offer, through the list price itself. If a home in your target pocket has not moved list in three weeks, the seller usually is not far from the number; if it has cut once already, the room is often already spent.
Seasonality is real, and it favors patient buyers in fall. Peak listing activity runs February through July. By August the flow slows, and homes that did not sell in the summer window carry visible days on market, which changes negotiating leverage. A relocation buyer with flexibility on move date can often do better between mid-September and mid-November than in the spring rush.
A short FAQ
Is Boulder still a seller's market in 2026? By the standard definition it is balanced. Days on market above 45 and a sale-to-list ratio just under 98% put the city in neutral territory as of May 2026. The important caveat is that "balanced" is a citywide read; specific pockets with trail adjacency or downtown walkability still behave like a seller's market on a properly priced listing.
How different are Boulder city and Boulder County numbers? Materially different. Boulder County's April 2026 median was around $736,000, roughly $180,000 below the city figure. That gap is Longmont, Lafayette, Louisville, and Erie pulling the average down, which is also why buyers who broaden the search by fifteen minutes often gain both space and newer construction.
What about investor competition? Lower than most Front Range cities. Investor purchases were around 12% of Boulder transactions in early 2026, compared to about 18% in Denver. Owner-occupant buyers are the primary competition on most listings under $1.5M.
Is condo pricing telling me something different than single-family pricing? Yes. Condo price-per-square-foot in the Pearl Street walk-shed runs high because walkability there scores in the 90s, but total-price entry is lower. If you are comparing a $650,000 condo near Pearl to an $850,000 single-family in Martin Acres, you are comparing two different assets, not two points on the same curve.
The takeaway before the first showing
The citywide median is a fine starting point for a conversation and a poor basis for a purchase. Before you tour, decide which of Boulder's four sub-markets you are actually shopping: the attached-and-outlying value tier, the mid-century single-family core, the walkable-and-renovated middle, or the historic-and-adjacent top. Price your search to that pocket. Then read days on market and sale-to-list on comparable homes in that pocket only. The Boulder you can afford, and the Boulder you actually want, usually get clearer inside twenty minutes of that exercise.
If you would like a block-level read on the pocket that fits your budget, timeline, and lifestyle, Marie Jacobs can put a tailored comparison in your hands, along with an instant valuation on the home you may be selling to fund the move. Get your instant home valuation and let's start with your numbers, not the portals'.